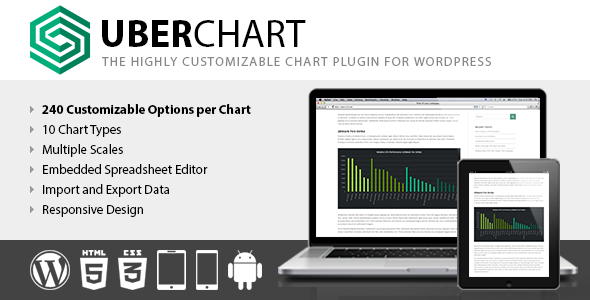
UberChart features
- Line Charts
- Area Charts
- Bar Charts
- Horizontal Bar Charts
- Pie Charts
- Doughnut Charts
- Radar Charts
- Polar Area Charts
- Scatter Charts
- Bubble Charts
- Define the bezier curve tension of each line, this allows you to represent straight or curved lines
- Define the width of each line, create dashed lines with custom gaps and also select the lineCap and lineJoin canvas properties of each line
- Set the point style of each point (circle, triangle, rectangle, cross, line, star, dash and more)
- Select how each point should react when hovered, for example you can define the exact radius that reacts to the hover mouse event
- Set the radius, the border and the background color of each point or bubble (in both hover and default status)
- Set the background and border color of each single bar displayed in a bar chart (in both hover and default status)
- Set the background and border color of each arc displayed in a Polar Area, Pie or Doughnut chart (in both hover and default status)
Junior
- File downloads:
- Valid:
Pay with
Developer
- 30 monthly downloads
- +5 downloads on each automatic renewal
- (Optional) Refill the number of downloads for a flat fee
Subscribe
We serve cookies on this site to analyze traffic, remember your preferences, and optimize your experience.
